|
|

|
City of Boulder Storm Water Quality Program |
|
Boulder Creek Watershed
Fecal Coliform Time Series for 2001
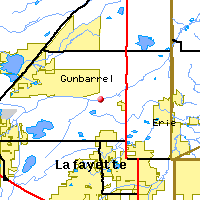
Boulder Creek at 95th St |
Preliminary Data - subject to revision
|
|
|
 |
 Indicates no data available Indicates no data available |
 Indicates data exceeds plot scale. Indicates data exceeds plot scale. |
|
|
Information on Fecal Coliform:
Fecal Coliform Bacteria
is found in the intestinal tracts of mammals. High concentrations of the bacteria in water or sludge suggest the presence of disease-causing organisms, and may be caused by septic tank failure, poor pasture and animal keeping practices, pet waste, and urban runoff. To measure fecal coliform bacteria, water samples are collected in sterilized containers, filtered, and incubated at a certain temperature. The resulting bacterial colonies that form are counted and recorded as the number of colony producing units per 100 ml of water (CPU/100 ml). Safe drinking water should have fecal coliform counts of 0 CPU/100 ml. For safe swimming, concentrations less than 200 CPU/100 ml is desirable, and for boating, less than 1000 CPU/100 ml is desirable. However, these standards may vary at the local, state, and federal level. |
|
More general information about Fecal Coliform
|
|
|
Interpretation of Boulder Creek Fecal Coliform data
|
|
|
|
Monitoring site information: |
|

|
- Location: Boulder Creek at 95th St
- Name: BC-95
- Type: Composite
- Frequency: Monthly
- Longitude: 105 ° W 78'
- Latitude: 40 ° N 28'
- Elevation: 5050 feet asl
- Site photo
|
|
| Downstream Site: Boulder Creek at 107th St |
| Upstream Site: Boulder Creek above Dry Creek |
|
| Plot Label |
Date |
FColi
#/100 mL |
| 01 |
January, 2001 |
50 |
| 02 |
February, 2001 |
80 |
| 03 |
March, 2001 |
70 |
| 04 |
April, 2001 |
330 |
| 05 |
May, 2001 |
200 |
| 06 |
June, 2001 |
490 |
| 07 |
July, 2001 |
3500 |
| 08 |
August, 2001 |
230 |
| 09 |
September, 2001 |
230 |
| 10 |
October, 2001 |
130 |
| 11 |
November, 2001 |
80 |
| 12 |
December, 2001 |
80 |
| *value below detection limit: |
|---|
| Detection Limit (if available) |
20.0 |
|---|
|
Preliminary Data - subject to revision
|
|
Select on the parameter name to view all Fecal Coliform time series plots on the basin map.
Select on the table date to view stream Fecal Coliform profiles observed on that date.
Select here to view all parameters at this site.
|
INVITATION:
BASIN is a community project actively seeking public participation. We
appreciate all feedback and welcome comments, suggestions and contributions.
To find out more about how you can be involved,
click here.
|
|
Home
| Site Map
| Glossary
| Bibliography
| Contributors
About BASIN
| Attribution
| Feedback
| Search
|
