 Streamflow
Reconstructions from Tree Rings: an Example from Middle Boulder Creek
Streamflow
Reconstructions from Tree Rings: an Example from Middle Boulder Creek
NOAA Paleoclimatology Program
National Geophysical Data Center
email: woodhous@ngdc.noaa.gov
Introduction
 Water
resource planning requires knowledge of the range of natural streamflow
variability over time. What is the lowest annual streamflow one might expect
over a given period of time? What is the highest? What is the long-term
average? How many below-average years in a row might be expected? The time
frame of reference for answering these questions is typically less than
50 years, the length of time for which streamflow records have been kept.
This short period of time does not allow an evaluation of the representativeness
of the 20th century in a longer context, which is needed to detect
long-term trends or changes. It also does not allow us to determine whether
events such as the 1950s drought are rare events, or if they are something
we should expect to occur every so often.
Water
resource planning requires knowledge of the range of natural streamflow
variability over time. What is the lowest annual streamflow one might expect
over a given period of time? What is the highest? What is the long-term
average? How many below-average years in a row might be expected? The time
frame of reference for answering these questions is typically less than
50 years, the length of time for which streamflow records have been kept.
This short period of time does not allow an evaluation of the representativeness
of the 20th century in a longer context, which is needed to detect
long-term trends or changes. It also does not allow us to determine whether
events such as the 1950s drought are rare events, or if they are something
we should expect to occur every so often. Tree rings are natural recorders
of climate variability and have proven to be useful for extending records
of climate and streamflow back hundreds of years. Tree growth is related
to a variety of climatic and non-climatic factors which are integrated
into patterns of annual ring widths. Tree rings can be used to reconstruct
streamflow because growth is often controlled by the same climate-related
factors, including precipitation and evapotranspiration, that influence
streamflow variability. Thus, variations in ring widths can match variations
in streamflow. Trees growing in the semi-arid western United States, including
the Colorado Front Range, depend on winter and spring precipitation to
recharge soil moisture, and since this precipitation also influences streamflow,
these trees are useful for reconstructing annual streamflow.
Reconstructions of
past streamflow from tree rings
 To
reconstruct streamflow, trees that are sensitive to the same set of climatic
conditions that influence streamflow must be sampled. Trees that are growing
on open slopes and on dry, well-drained soils are good candidates, whereas
those growing close to the stream channel are usually not. Trees in drainages
received more moisture so are less sensitive to climate variations and
do not record climate variations as well as trees growing on dry slopes.
Although tree growth is also influenced by non-climate factors (such as
fire, insect infestation, and competition between trees), careful selection
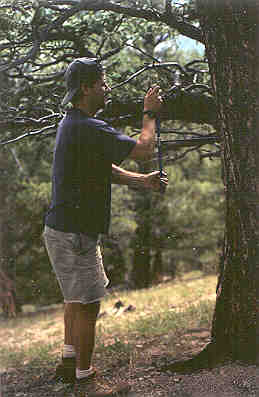
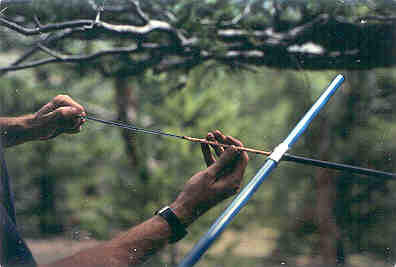
of trees can reduce these effects. Trees are sampled with a tool called
an increment borer that removes a thin core from the tree, and does not
harm the tree. The photos on this page show, first, a researcher inserting
an increment borer into a tree, and then, the core as it comes out of
the tree. Typically 20-40 trees per site are sampled in order to screen
out variations in growth that are specific to individual trees, and enhance
the common climate-related signal .
To
reconstruct streamflow, trees that are sensitive to the same set of climatic
conditions that influence streamflow must be sampled. Trees that are growing
on open slopes and on dry, well-drained soils are good candidates, whereas
those growing close to the stream channel are usually not. Trees in drainages
received more moisture so are less sensitive to climate variations and
do not record climate variations as well as trees growing on dry slopes.
Although tree growth is also influenced by non-climate factors (such as
fire, insect infestation, and competition between trees), careful selection
of trees can reduce these effects. Trees are sampled with a tool called
an increment borer that removes a thin core from the tree, and does not
harm the tree. The photos on this page show, first, a researcher inserting
an increment borer into a tree, and then, the core as it comes out of
the tree. Typically 20-40 trees per site are sampled in order to screen
out variations in growth that are specific to individual trees, and enhance
the common climate-related signal .
After collections are complete,
the samples are taken back to the laboratory, mounted in wooden core mounts
and well-sanded. It is necessary to carefully sand cores so that individual
cells within the rings can be discerned under the microscope. Next, all
growth rings are dated, using a ring-width pattern-matching technique
called skeleton plotting, and then measured with a computer aided measuring
system. The resulting series of ring width measurements are averaged together
to create a site chronology. A number of statistical operations are applied
in compiling a site chronology to further enhance the common climate-related
signal. The two most fundamental are eliminating the age-related growth
trend in the tree-ring series and removing the correlation between growth
in one year and the next, which is largely due to biological processes.
To reconstruct streamflow from
tree rings, variations in year-to-year growth, represented by one or more
tree-ring chronologies, are calibrated with the instrumental streamflow
record using a regression equation, which expresses the relationship between
the two records. This equation is then used to reconstruct the streamflow
record back in time for the length of the tree-ring record. The skill
of the reconstruction is evaluated by comparing observed instrumental
streamflow values with the values produced by the reconstruction.
Middle Boulder Creek
streamflow reconstruction
Middle Boulder Creek mean monthly streamflow was reconstructed using four
tree-ring chronologies from the Front Range (Figure
1). The trees are not growing very close to Middle Boulder Creek,
but their growth is controlled by large regional patterns of atmospheric
circulation. These same patterns also influence variations in the streamflow.
The four chronologies were used in a regression equation to estimate mean
annual streamflow for the years 1950-1980. This equation was then applied
to the tree-ring records for 1912-1949 as an independent verification
of the model. The actual streamflow values and the reconstructed values
for both the calibration period (1950-1980) and the verification period
(1912-1949) are shown in Figure 2. The reconstruction
from tree rings explains about 60% of the variation in the streamflow
record.
Very dry climate conditions,
limiting to both tree growth and streamflow, tend to be duplicated more
accurately in the reconstructions than very wet conditions. (When trees
already have abundant moisture, further precipitation may not result in
more tree growth.) This effect can be seen in Figure
2, where low flow values for years such as 1922, 1925, and 1966 are
closely matched by the reconstructed values, while high flow for years
such as 1921, 1923, and 1957 are underestimated by the reconstruction.
In general, extreme values tend to be muted as a result of the regression
process and as a consequence, reconstructions are usually a conservative
estimate of past variability.
Figure 3 shows the full reconstruction of Middle Boulder annual streamflow, 1703 to 1987. The reconstruction has been smoothed to facilitate comparisons of low flow events. The reconstruction captures the 20th century periods of low flow (1930s,1950,s mid-1960s), but these events appear to be moderate compared to low flow events in previous centuries. In particular, there are several episodes of persistent and extreme low flow values in the 19th century, during the 1840s and the 1880s. There is also a period of extreme low flow in the early 1700s. This period may be exaggerated somewhat, because fewer trees are in the earliest part of the record, but other reconstructions for the region also show this to be a dry period.
Low flow events in
Middle Boulder Creek
How does the 20th
century record of flow compare to the full 300-year record? We can look
at distribution of extreme low flow events to answer this question. For
this analysis, reconstructed flow values for single years, 3-year averages,
and 5-year averages were ranked. Those that fell into the driest 10% of
flow years were grouped according to the half-century periods in which
they occurred. Figure 4 shows how these dry
event single years and 3- and 5-year averages are distributed over the
past three centuries. The extreme low flow single years are fairly evenly
distributed across time, with concentrations of extreme values in the
1840s and 1880s, and a marked lack of extremes in the first half of the
20th century (Figure 4, top). The
three-year averages show a greater clustering of low flow periods, with
the bulk occurring in two 19th century periods, along with
a peak of extreme values in the early 18th century (Figure
4, middle). The extreme events in the 20th century are
primarily associated with the 1950s drought. The five-year average extreme
lowest flows occur almost exclusively in the 19th century (Figure
4, bottom), and are concentrated around 1880, 1887, and the decade
of the 1840s. This examination of extreme values suggests that multi-year
low flow periods are not evenly distributed across time. Specifically,
the 19th century appears to be characterized by much more frequent
extremely low three- and five-year flow conditions than either the previous
or following centuries.
Summary
Tree-ring reconstructions of streamflow have proven to be extremely useful for extending records of streamflow back in time. These extended records help us better understand the range of natural streamflow variability, and are vital for assessing the representativeness of the 20th century record. This reconstruction suggests that the 20th century record of Middle Boulder Creek streamflow may not be representative of flow in past centuries. If the record of past variability is used as a guide to the future, then it might be wise to acknowledge the possibility of more persistent low flow events in the future.
Although tree-ring reconstructions
of streamflow offer invaluable insights on the long term and low-frequency
behavior of streamflow, further work is being done to increase the usefulness
of these records for water resource management and planning.
For further information
on tree rings and drought
More details on tree rings
and the science of dendrochronology can be found within in this web page:
More
information about reconstructions of past drought in North America from
tree rings and other types of paleoclimatic data can be found within this
web site:
http://www.ngdc.noaa.gov/paleo/drought/drght_home.html
References on tree-rings and reconstructions of streamflow in the western U.S.
Fritts, H.C., 1976. Tree Rings and Climate. Academic Press, London.
Meko, D. and D.A. Graybill, 1995. Tree-ring reconstructions of upper Gila River discharge. Water Resources Bulletin 31:605-615.
Meko, D., C.W. Stockton, and W.R. Boggess, 1995. The tree-ring record of severe sustained drought. Water Resources Bulletin 31:789-801.
Smith, L.P. and C.W. Stockton, 1981. Reconstructed stream flow for the Salt and Verde Rivers from tree-ring data. Water Resources Bulletin 17:939-947.
Stockton, C.W. and G.C. Jacoby, 1976. Long-term surface water supply and streamflow levels in the upper Colorado River basin. Lake Powell Research Project Bulletin No. 18, Inst. of Geophysics and Planetary Physics, University of California, Los Angeles, 70 pp.
Return to Drought, Fire & Flood Homepage
Drought - Fire - Flood - It's All Connected