 Boulder
Reservoir An Important Water Resource
Boulder
Reservoir An Important Water Resource
By Jim Shelley
City of Boulder
Water Resource Description
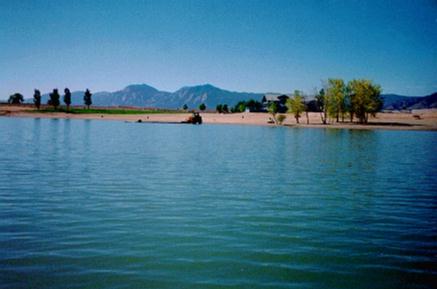
The Boulder Reservoir natural watershed encompasses a nine square mile area north of Boulder and just east of the foothills. The land adjacent to the reservoir is mainly city open space where well-managed grazing, light recreation and grass/hay crop production occur. Also contained within this watershed are Lake Valley Estates and golf course, plus Left Hand Valley Reservoir.
Boulder Reservoir was constructed in 1955 for irrigation and drinking water. It’s owned by the City of Boulder and operated by Northern Colorado Water Conservancy District. Boulder Reservoir is a class 1 warm water fishery. It’s a low volume shallow (depth normally ranges from 19 to 28 feet deep) reservoir with a surface area of 700 acres and a capacity of 13,270 acre-feet. Between 80 and 90 percent of the water in the reservoir comes from the Boulder Feeder Canal (BFC). The BFC is part of the 954 square mile Colorado Big Thompson and Windy Gap watershed projects. Small flows (listed in order of total flow) also enter the reservoir on the west side from Dry Creek, Farmer's Ditch (summer months only), Little Dry Creek and the Unknown Ditch.
Reservoir Operation
Boulder Reservoir is part of the Colorado Big Thompson and Windy Gap Water Projects which supply irrigation water to the South Platte Basin. High irrigation flows pass through the reservoir during the summer months. Since 1993, the reservoir has received an average of 17,338 acre feet of BFC water between April and November, (1.3 times the volume). Maximum BFC flows were recorded the summer of 1994 (33,662 acre feet, 2.5 times the volume). Typically Boulder Reservoir is filled in June and taken down to winter levels (half the capacity) by the end of August. Every five years the reservoir is drawn way down to 1,300 acre feet for dam outlet inspection and repair. Peak monthly canal flows can be as high as 9,500 acre feet which occurred during the hot dry July of 1994. At this flow rate the reservoir can be filled from low winter levels in only three weeks.
Uses
Boulder Reservoir is a multi-use reservoir. It is used for drinking water, irrigation and recreation (boating, skiing, fishing, swimming, hiking/jogging and wildlife observation). Boulder Reservoir resources currently supply 20 percent of Boulder's drinking water. The reservoir watershed is good habitat for a variety of wildlife.
Water Quality Issues
1. Non-point storm water runoff along the Boulder Feeder Canal
2. Future urban development along the Boulder Feeder Canal
3. Dumping and spills into Farmer's Ditch and the Boulder Feeder Canal
4. Fairways Metro Waste Water Treatment Plant effluent golf course land application in the summer (.085 MGD)
5. Left Hand Creek spring runoff
6. Recreational activities on and around the reservoir
7. Runoff from Lake Valley Estates and the Lake Valley Golf Course
- Proposal to build a recreational trail system adjacent to and up gradient of the Boulder Feeder Canal
Water Quality Monitoring Data and Trophic Condition
The goals of the Boulder Reservoir Watershed monitoring program are to develop baseline trends, evaluate point and non-point sources of pollution, determine when change has occurred and make recommendations to preserve water quality and Boulder Reservoir trophic condition. At this time, Boulder Reservoir is mesotrophic which means the reservoir is in fairly good condition (table 1). This trophic state estimate for Boulder Reservoir was determined using the Trophic State Index (TSI) tables developed by Carlson (1977). Photic zone data (twice the secchi depth) from March through November were averaged. These mean values were than compared with Carlson's tables to determine trophic state. The secchi disk values indicated a high mesotrophic situation; this is due to suspended inorganic clay turbidity stirred up from windy shallow water conditions. Chlorophyll a values are the best estimate of phytoplankton biomass and thus were used as the deciding factor in determining Boulder Reservoir’s trophic state. It’s important to keep in mind that trophic state indicators for Boulder Reservoir are probably highly influenced by irrigation water flow through and low summer retention times.
Table 1. (Boulder Reservoir Trophic Condition average values 1997-1999)
|
Date |
Dis OP (ug/L) |
TP (ug/L) |
TP TSI |
Chloro a (ug/L) |
Chloro a TSI |
Secchi (m) |
Secchi TSI |
|
1997 Avg |
0.5 |
16.4 |
44 |
4.0 |
44 |
1.5 |
54 |
|
1998 Avg |
0.1 |
9.5 |
37 |
2.6 |
39 |
1.5 |
54 |
|
1999 Avg |
0.2 |
13.6 |
42 |
3.3 |
43 |
1.4 |
53 |
|
Trophic State |
|
Low Mesotrophic |
Mesotrophic |
High Mesotrophic |
|||
Low levels of available dissolved ortho phosphorous indicate that phosphorous is the limiting nutrient to the reservoir (Table 1). Increased nutrient loading, especially phosphorous, from land use within the Boulder Reservoir Watershed and along the Boulder Feeder Canal will accelerate the eutrophication process. Eutrophic conditions in Boulder Reservoir would be costly to both water treatment and recreation. These conditions would adversely affect drinking water in the following ways:
1. Increased total organic carbon (TOC) producing more disinfection by-product precursors
2. Greater opportunity for bottom anoxic conditions resulting in more dissolved iron and manganese release from the sediments
3. Difficult to treat taste and odors
Eutrophic conditions would have a negative impact on recreation by creating esthetically displeasing phytoplankton blooms and reduced game fish populations.
With phosphorous being the most important nutrient for phytoplankton growth in the reservoir, it’s important that we look at loading rates for phosphorous. The greatest total phosphorous contributions are from the Boulder Feeder Canal (1998-482 lbs/yr, 1999-292 lbs/yr). The feeder canal accounts for approximately 75 percent of the total phosphorous load to Boulder Reservoir. This is due to the large annual flow from the canal versus the small western tributaries. During the initial 1995 Farmer's Ditch spring start-up flush (after the ditch was dry for the winter) a high total phosphorous number was observed (890 ug/L). From this data we know that spring ditch and canal start-up flows contribute high avoidable amounts of total phosphorous and sediment to Boulder Reservoir. It’s good management practice to divert if possible these initial ditch cleaning flows around Boulder Reservoir. We have this opportunity with Farmer's Ditch but not with the feeder canal.
The highest dissolved ortho phosphorous loading rates are also observed from the canal, due to the fact that 80 to 90 percent of the flow into the reservoir is from the Boulder Feeder Canal. It’s very important to track available ortho phosphorous throughout the year in all tributaries, because this variable appears to control the phytoplankton biomass and trophic condition of Boulder Reservoir at any point in time.
Dr. Kugrens at CSU performed monthly phytoplankton counts from November 1993 through 1998. During this time period 89 different species were observed. Greens dominated (66 percent) followed by bluegreens (31.5 percent), golden browns (1.6 percent) and Cryptomonads (0.9 percent). The following two species are the reason for the high green and bluegreen population percentages. Large numbers of the small spherical Chlorella minuta made up 99.8 percent of the green alga population. Synechocystis diplococcus comprised 99.8 percent of the bluegreen population. This bluegreen algae first appear in Boulder Reservoir July 1996 and has been detected consistently since that time. The significance of the Synechocysitis appearance in 1996 is unknown. Five of the eight major phytoplankton population peaks from 1993 through 1998 have occurred in the fall. Four of these were after the official fall turnover. The other large peaks were observed in late July, early March and early June.
Total organic carbon (TOC) values averaged 3.7 mg/L from 1994 through 1999, with peaks as high as 5.2 mg/L during June 1995. This increase in reservoir TOC maybe related to the 1995 spring runoff flooding. After June 1995, values have gradually dropped back down below 3.7 mg/L.
Fecal coliform bacteria counts in the surface and bottom reservoir samples near the plant intake structure show higher numbers at the bottom. The last two summer bottom counts were consistently above 10 cfu/100mls from July through November. Counts above 20 are considered a contaminated drinking water source by the EPA ICR. Six summer monthly counts over the last two years have exceeded this limit. Fecal coliform bacteria are not a health concern because they are easily disinfected at the water plant, however they are an indication of animal or human fecal contamination possibly containing protozoans and viruses which are resistant to disinfection and can’t always be removed 100 percent of the time at the water plant.
Boulder Feeder Canal (BFC) Flows are important to Water Quality in the Reservoir
BFC flows are very important to Boulder Reservoir for two reasons:
1. Dilution of total dissolved solids within the reservoir.
2. Helps circulate the reservoir during the summer months which prevents anoxic conditions from occurring near the sediments.
On an annual basis total dissolved solids (TDS) peak in April prior to the BFC input and are at their lowest levels in October after the low TDS canal water deliveries are complete. High summer canal flows through the reservoir mean lower TDS levels prior to the winter canal shut down. During the winter the only tributaries to the reservoir are ground water and the small western creeks which are very high in TDS. From 1993 through 1999 the following reservoir trends have been observed. Sodium values averaged 12 mg/L with a peak of 20 mg/L. Sulfate averaged 91 mg/L, with a recorded high of 170 mg/L. Hardness and alkalinity values averaged 140 and 70 mg/L with peaks of 225 and 95 mg/L respectively. Peak reservoir numbers were recorded in April 1997 after a below average BFC summer flush and during a winter draw down for dam repairs.
The canal flows also help circulate the reservoir, thus maintaining dissolved oxygen near the sediments. Starting mid-May if the reservoir is allowed to sit stagnant for a six week period, anoxic conditions in the hypolimnion are observed. Zero dissolved oxygen concentrations have been recorded in early July 1996, 1997 and 1999. During these anoxic conditions, dissolved manganese concentrations at the bottom of the reservoir have been recorded as high as 1.0 mg/L. The Boulder Reservoir Water Plant Intake is only a couple of feet off the bottom of the reservoir, so these high amounts of dissolved manganese are drawn straight into the plant. In order to avoid colored water in the distribution system the dissolved manganese must be oxidized and removed at the water plant. High canal flows, through the reservoir create enough circulation to reoxygenate the hypolimnion. Irrigation releases from the bottom of the reservoir remove anoxic hypolimnion water allowing oxygenated epilimnion water to replace it. In addition to this, incoming denser and colder BFC water sinks to the bottom also creating circulation and oxygenation of the hypolimnion.
Canal deliveries are very important for water quality during the winter and summer months. The greater amount of water moving through the reservoir the better the drinking water quality throughout the year.
Recommendations for Water Quality Protection
Watershed point and non-point sources of pollution need further evaluation followed by recommendations to mitigate. In addition to this, other studies need to be conducted to determine the origin of nutrient peaks and to verify the trophic condition of Boulder Reservoir. Some recommendations we have at this point are as follows:
1. Canal and reservoir operational procedures need to be formalized to maintain the lowest possible dissolved solids and adequate dissolved oxygen levels in the reservoir.
2. Wetlands constructed along Dry Creek would help remove nutrients. Nutrients would be consumed and converted to TOC prior to entering the reservoir and would not be available for TOC production within the reservoir, thus reducing disinfection by-product precursors.
3. Divert the Farmer's Ditch spring cleaning flush around Boulder Reservoir in order to avoid unnecessary high phosphorous and sediment loads.
4. Encourage open space managers to plant grass-hay crops rather than annuals. Grass-hay require less maintenance (ie. pesticides, fertilizers, water and tilling).
5. Post the BFC and Farmer's Ditch as part of the Boulder Reservoir drinking water supply watershed to discourage dumping.
6. Construct BFC sedimentation basins prior to the reservoir to accommodate the spring cleaning flush and provide a way to isolate accidental spills.
7. Divert all 43 storm water outfalls over or under the Boulder Feeder Canal. This would reduce storm water nutrient, sediment and microbiological loads to the reservoir. Work with county planners and developers to insure that storm water runoff issues along the canal are addressed early on in the planning process.
8. Inform people recreating in the Boulder Reservoir Watershed that the reservoir is a major drinking water supply for Boulder.
9. Inform supporters of the Boulder Feeder Canal trail system of the increased water quality risks (pathogens, nutrients and increased sediment load) to this very important City of Boulder water supply.
10. Continue to evaluate multi-use recreational activities on Boulder Reservoir in order to predict future impacts.