|
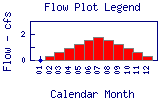
Map bar plots are plotted on the following scale   indicates no data available. indicates no data available. | |
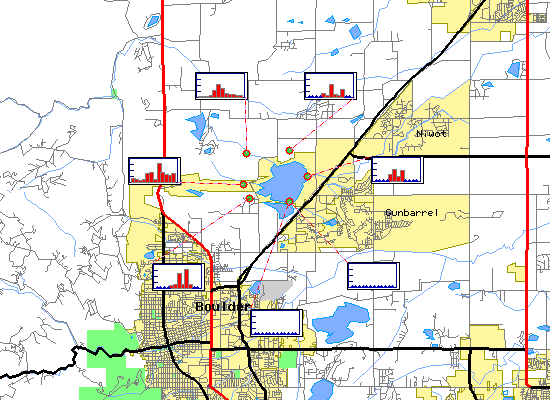
Boulder Reservoir Stream Flow Time Series for 1999 |

|
Map bar plots are plotted on the following scale   indicates no data available. indicates no data available. | |
Boulder Reservoir Stream Flow Time Series for 1999 |

Select on the map plot to view detailed time series information for Stream Flow at that site. Select on the site icon to view time series information for all parameters at that site.
Flow is the volume of water moving past a point in a unit of time. Two things make up flow: the volume of water in the stream, and the velocity of the water moving past a given point. Flow affects the concentration of dissolved oxygen, natural substances, and pollutants in a water body. Flow is measured in units of cubic feet per second (cfs). Peak flows for Boulder Creek in the spring can reach as high as 300-800 cfs and as low as 10-50 cfs in the fall months. | |||||||
| |||||||
|
About BASIN | Attribution | Feedback | Search | |||||