|
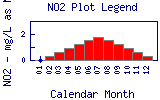
Map bar plots are plotted on the following scale   indicates no data available. indicates no data available. | |
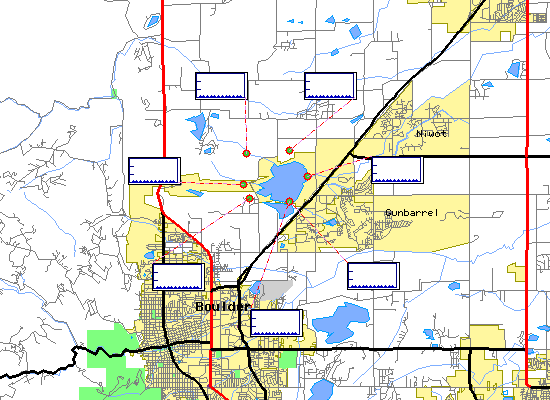
Boulder Reservoir Nitrite Time Series for 2000 |

|
Map bar plots are plotted on the following scale   indicates no data available. indicates no data available. | |
Boulder Reservoir Nitrite Time Series for 2000 |

Select on the map plot to view detailed time series information for Nitrite at that site. Select on the site icon to view time series information for all parameters at that site.
| |||||||||
| |||||||||
|
About BASIN | Attribution | Feedback | Search | |||||