|
|

|
City of Longmont Water Quality Monitoring |
|
Saint Vrain Watershed
Total Alkalinity Time Series for 2000
St. Vrain River at Boulder Creek |
Preliminary Data - subject to revision
|
|
|
 |
 Indicates no data available Indicates no data available |
 Indicates data exceeds plot scale. Indicates data exceeds plot scale. |
|
|
Information on Total Alkalinity:
Alkalinity
refers to how well a water body can neutralize acids. Alkalinity measures the amount of alkaline compounds in water, such as carbonates (CO3 2-), bicarbonates (HCO3 -), and hydroxides (OH-). These compounds are natural buffers that can remove excess hydrogen ions that have been added from sources such as acid rain or acid mine drainage. Alkalinity mitigates or relieves metals toxicity by using available HCO3 - and CO3 2- to take metals out of solution, thus making it unavailable to fish. Alkalinity is affected by the geology of the watershed; watersheds containing limestone will have a higher alkalinity than watersheds where granite is predominant. The Boulder Creek Watershed is composed primarily of granite rocks, thus the water has a lower alkalinity content. |
|
More general information about Total Alkalinity
|
|
|
Interpretation of Saint Vrain Total Alkalinity data
|
|
|
|
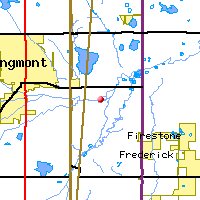
Monitoring site information: |
|
- Location: St. Vrain River at Boulder Creek
- Name: SVaBC
- Type: Unknown
- Frequency: Unknown
- Longitude: 105 ° W 14'
- Latitude: 40 ° N 89'
- Elevation: feet asl
|
|
| Downstream Site: St. Vrain River at Airport Road |
| Upstream Site: St. Vrain River at County Line Road |
|
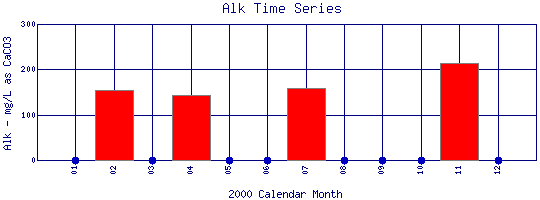
| Plot Label |
Date |
Alk
mg/L as CaCO3 |
| 01 |
January, 2000 |
No Data |
| 02 |
February, 2000 |
154 |
| 03 |
March, 2000 |
No Data |
| 04 |
April, 2000 |
144 |
| 05 |
May, 2000 |
No Data |
| 06 |
June, 2000 |
No Data |
| 07 |
July, 2000 |
159 |
| 08 |
August, 2000 |
No Data |
| 09 |
September, 2000 |
No Data |
| 10 |
October, 2000 |
No Data |
| 11 |
November, 2000 |
213 |
| 12 |
December, 2000 |
No Data |
| *value below detection limit: |
|---|
| Detection Limit (if available) |
1.0 |
|---|
|
Preliminary Data - subject to revision
|
|
Select on the parameter name to view all Total Alkalinity time series plots on the basin map.
Select on the table date to view stream Total Alkalinity profiles observed on that date.
Select here to view all parameters at this site.
|
INVITATION:
BASIN is a community project actively seeking public participation. We
appreciate all feedback and welcome comments, suggestions and contributions.
To find out more about how you can be involved,
click here.
|
|
Home
| Site Map
| Glossary
| Bibliography
| Contributors
About BASIN
| Attribution
| Feedback
| Search
|