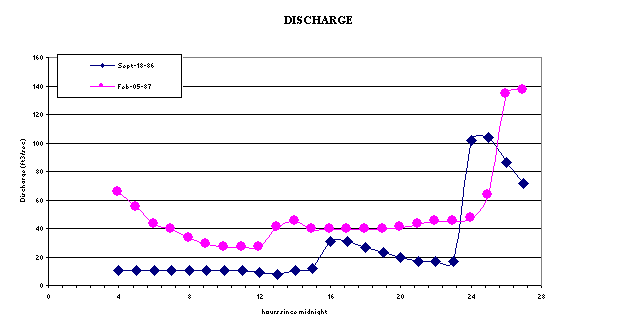
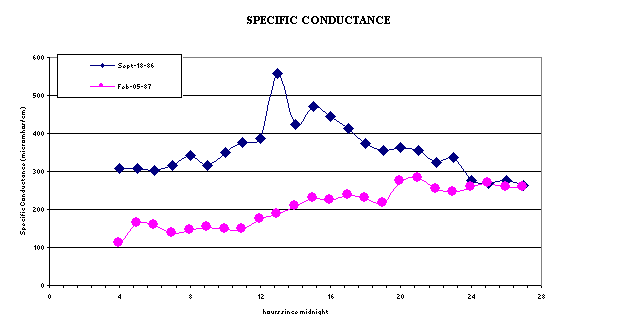
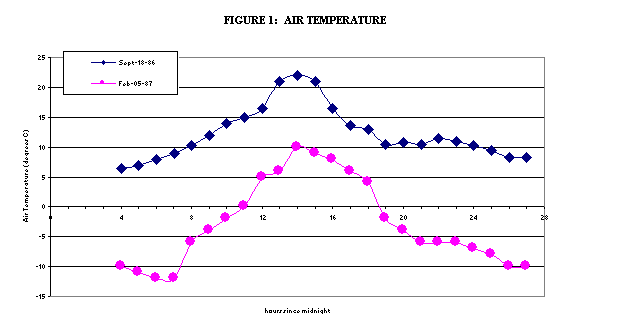
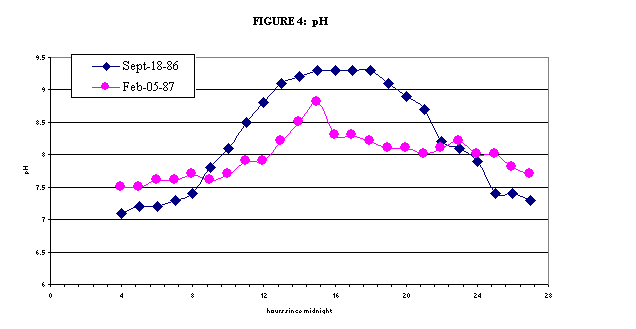
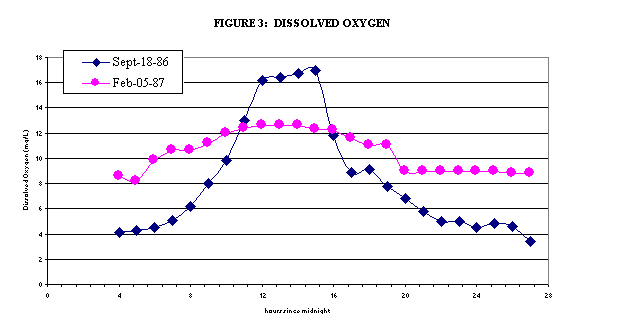
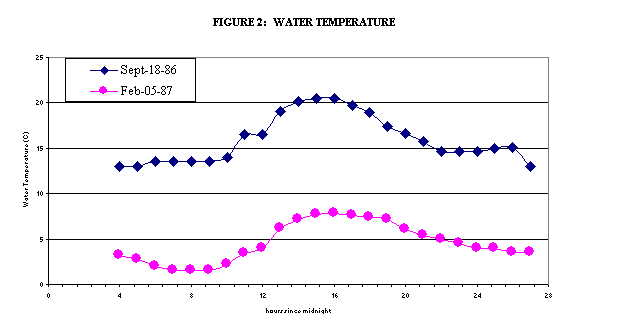
| hour | DO | pH | temp (stream) | SC | temp (air) | discharge (ft3/sec) |
| Feb-05-87 | ||||||
| 4 | 8.6 | 7.5 | 3.2 | 110 | -10 | 65.2 |
| 5 | 8.2 | 7.5 | 2.7 | 164 | -11 | 55 |
| 6 | 9.8 | 7.6 | 2 | 157 | -12 | 43 |
| 7 | 10.6 | 7.6 | 1.5 | 136 | -12 | 39 |
| 8 | 10.6 | 7.7 | 1.5 | 146 | -6 | 33 |
| 9 | 11.2 | 7.6 | 1.5 | 152 | -4 | 29 |
| 10 | 12 | 7.7 | 2.2 | 147 | -2 | 27 |
| 11 | 12.4 | 7.9 | 3.4 | 148 | 0 | 27 |
| 12 | 12.6 | 7.9 | 4 | 174 | 5 | 27 |
| 13 | 12.6 | 8.2 | 6.2 | 187 | 6 | 41 |
| 14 | 12.6 | 8.5 | 7.2 | 209 | 10 | 45 |
| 15 | 12.3 | 8.8 | 7.7 | 229 | 9 | 39 |
| 16 | 12.2 | 8.3 | 7.8 | 223 | 8 | 39 |
| 17 | 11.6 | 8.3 | 7.6 | 237 | 6 | 39 |
| 18 | 11 | 8.2 | 7.4 | 229 | 4 | 39 |
| 19 | 11 | 8.1 | 7.2 | 216 | -2 | 39 |
| 20 | 9 | 8.1 | 6.1 | 275 | -4 | 41 |
| 21 | 9 | 8 | 5.4 | 282 | -6 | 43 |
| 22 | 9 | 8.1 | 5 | 253 | -6 | 45 |
| 23 | 9 | 8.2 | 4.5 | 245 | -6 | 45 |
| 24 | 9 | 8 | 4 | 257 | -7 | 47 |
| 25 | 9 | 8 | 4 | 268 | -8 | 63.1 |
| 26 | 8.8 | 7.8 | 3.5 | 259 | -10 | 133.8 |
| 27 | 8.8 | 7.7 | 3.5 | 258 | -10 | 136.7 |
About BASIN | Attribution | Feedback | Search
