The Environmental Fund of the Rockies site, located at the SW corner of Baseline and Broadway in Boulder, Colorado underwent a significant redevelopment several years ago. The owners of the site were committed to the goals of increasing the sustainability of the site by minimizing both the stormwater runoff from the site, and the use of treated water for on-site irrigation purposes. The site was redeveloped to route as much runoff as was possible through a series of three retention ponds, and several continuous monitoring stations were installed for measuring pond water stage. Additionally, site rainfall (on the roof), and several temperature zones were measured. On site surveying was completed in 1999. Figure 1.1 is a detailed topographical map of the site; this information is based upon the site plan, provided by Bill Wenck and Associates, and spot elevations conducted by Wright Water Engineers. A greater detail was needed for the basins along the north and east side of the site so that a detailed stage storage curve could be developed for each of them. This will enable the monitored stage heights to be directly translated into a volume of storage, which is critical in determining the relative efficiency of each of the basins. The data reduction and compilation of the stage storage curves is presently underway. Companion research underway by Len Wright for the Low Impact Development project has resulted in the development of a micro runoff model that can be used at these scales. Environmental Data Collection at ECR: Data collection is an ongoing activity. The University is responsible for collecting and maintaining a rain gage and several temperature and stage level gages. The following figures 1.2 and 1.3 summarize the data period from 4/1/1999 to 5/18/1999 for precipitation and temperature, respectively. There were several small storms recorded during this period. These events were significant enough to trigger stage readings in the basins; these are not presented here because of data quality and calibration problems. The data are downloaded on a periodic basis from the collectors on site and stored in a MS Excel 2000 file. |
 Technical
Details
Technical
Details
Figure 1.1: Environmental Fund of the Rockies, topographical/site plan
Figure 1.2: Precipitation, Land and Water Fund site, 4/1/1999 to 5/18/1999
Figure 1.3: Temperature, Land and Water Fund site, 4/1/1999 to 5/18/1
|
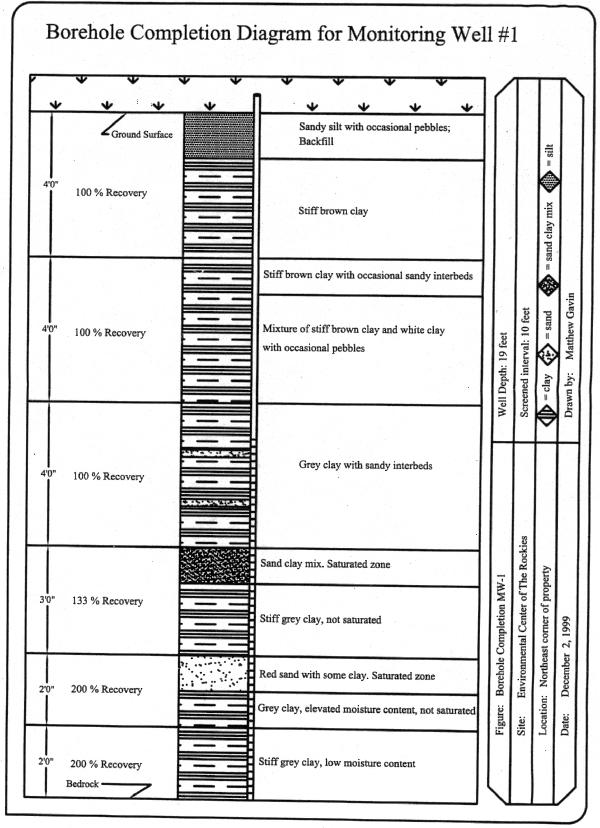
Monitoring Well Installation: A shallow (19 feet in depth) groundwater monitoring well was installed on the site in November, 1999. Several water bearing layers were encountered, the most significant occurred at about 7 feet in depth. The geology of the site is summarized in figure 4, consisting of clay mixed with sandy layers. Due to the shallow depth of groundwater, further study is warranted to determine the link between infiltration of stormwater and irrigation water to the shallow groundwater table
Figure 1.4: Borehole Completion Diagram for Monitoring Well #1 1.3 Spatial Analysis: The series of three retention ponds are quite small (see figure 1.5). In order to better understand the microhydrology and runoff of the site, a detailed topographical survey was done, and .15-meter (.5 foot) contour lines were constructed using Surfer. Drainage basins were then delineated based upon this topographical model. These are shown in table 1.1. These basins are plotted on the site plan shown in figure 1.1 A 3-D wireframe model of the site is depicted in figure 1.6. This model is based upon a grid consisting of approximately 200 survey points. The reader will note that because of the intense existing urban development on the site, it was not possible to economically capture the entire runoff volume, as much of the site flows directly off-site.
Figure 1.5: Retention pond area, Law Fund site Table 1.1: Basin delineation using GIS
By computing successive volumes of the retention ponds at different storage heights up to the pond weir level, the stage storage curve for the pond can be developed. The curve for pond #3 is shown in figure 1.7. Instead of the five drainage areas outlined in table 4, when delineating the site by hand (without using updated survey information) resulted in seven drainage areas of different shapes. Delineating Pond #3’s storage volumes by hand using available topography and field estimates yielded a maximum storage volume of 1066 cubic feet. Repeating this procedure using the grid and updated survey information yielded a volume of 1461 cubic feet, a difference of 27%. Increasing the density of survey points, at a higher associated cost, can enhance the degree of confidence in the topography presented. There is a tradeoff between the value of information obtained and the cost of the acquisition of the information. |


|
Figure 1.6: Environmental Fund of the Rockies, wireframe model. The deep depression is the location of the site building, and its effect on the grid has been removed.
Figure 1.7: Stage-Storage curve for Pond #3, Environmental Fund of the Rockies site Research is presently underway to characterize the water budget of this site, based upon the continuous measurements currently being collected, and a micro hydrological model being developed by Wright (1999). The goal of this work is to develop an evaluation and management tool to be used at this (or other) urban site to determine the appropriate land use and/or BMP controls to mitigate the effects of stormwater runoff from the site, similar to that which was used at the neighborhood scale. The methods presented in this paper allow hydrologic and economic analysis to be performed on several small scales not traditionally used in urban stormwater analysis. At these scales, GIS information is critical to the analysis; however, the value is enhanced by its use in the context of a complete DSS. Small scale must be used to properly evaluate on-site and neighborhood BMPs for the control of locally generated stormwater runoff. The inclusion of on-site control is amenable to optimization techniques. The use of LP techniques to optimize BMP strategies is possible by using curve number techniques to quantify storage effects of development. Extension of this work to smaller scales and more detailed hydrology will enable more general research to be conducted on the interaction between land management decisions and urban hydrology. Water Use Data: To take a cursory review of water use at the ECR site, monthly billing records were collected from the City of Boulder for both the indoor (main) and outdoor water meters. The outdoor water meter was installed in late 1998 after the redone landscaping was complete. Prior to late 1998, the indoor meter recorded outdoor was use as well. The indoor water use continues to show a strong summer related increase, this may be due to the use of evaporative cooling in the building. According to ECR officials, the evaporative coolers are used to cool the building until the outdoor temperature exceeds 80o F., at which point the first air conditioning compressor kicks on. The second compressor kicks on when the outdoor temperature exceeds 90oF. According to ECR officials, the timer for the irrigation system was malfunctioning, during the early period of its use, accounting for the spikes in July, August and September of 1999. |
|
Figure 1.8: Water Use from metered data at the Environmental Center for the Rockies site. The indoor use does show a decrease, however, indicating that the outdoor use has been removed from this meter. To get a better understanding of the indoor and outdoor water use at the ECR site, a two week data logging period will be done in June of 2000. The indoor water uses expected will consist of toilets, faucets, and (predominate in the summer), evaporative cooler useage. Outdoor use will be measured for each irrigation zone and irrigation efficiency calculated. Return to URBAN STORM RUNOFF |